The share buyback mirage
WHY don't equity investors get the full benefits of economic growth? Or to put it another way, why don't dividends grow as fast as GDP? We tend to assume that, over the course of the cycle, profits will grow in line with the economy. But research by Elroy Dimson, Paul Marsh and Mike Staunton of the London Business School, shows that real dividends in 21 countries fell by an average of 0.12% a year between 1900 and 2014; in the US, they grew by 1.7% but still below the GDP growth rate.
A plausible-sounding explanation is that, over time, the dividend payout ratio has fallen; companies are reinvesting more of their cash. Some companies, of course, don't pay dividends at all and paying high dividends is associated with mature, slow-growing companies; utilities, for example. But this reasoning does not really work at the aggregate level. If companies have been profitably reinvesting all their free cash, surely that would have showed up in higher dividends by now; the data cover more than a century. And research by Robert Arnott and Cliff Asness shows that high payout ratios are followed by periods of high earnings growth, not low. Low payout ratios were followed by periods of slow earnings growth; companies, in short, are not great at reinvesting.
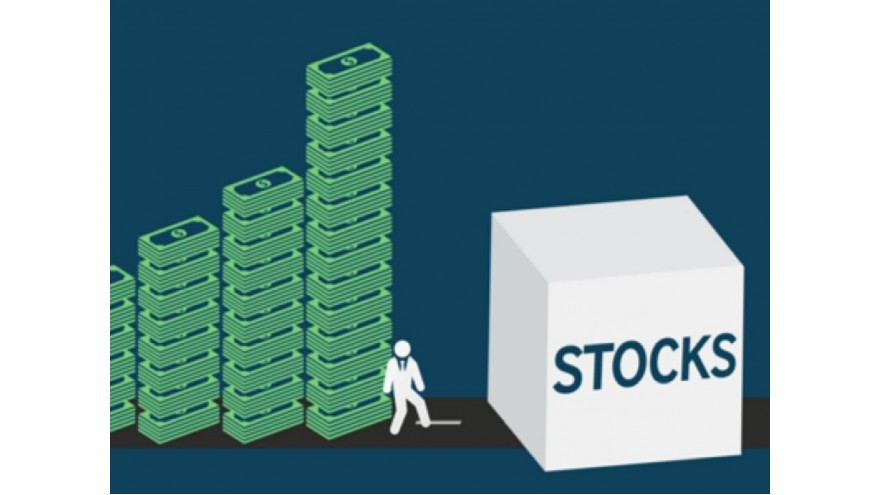
Some may dismiss dividends altogether; who cares about them when companies are distributing more of their cash in the form of buybacks? In 2014, the dividend yield on the S&P 500 was 1.9% but the buyback yield (the proportion of market capitalisation bought back by companies) was 2.9%. Taken together, that is a yield of 4.8%, offering an income far higher than most government bonds. On that basis, equities are a screaming bargain.
But hold on a minute. We need to return to why dividends haven't grown as fast as GDP. A related issue is why emerging market investors haven't enjoyed the same kind of returns from equities as the GDP growth records of such countries might have suggested. One reason is that, as economies grow, the amount of equities in issuance is not static; new companies float and existing companies issue new shares and these absorb the benefits of GDP growth. In a 2003 paper, William Bernstein and Robert Arnott described this as the "2% dilution" effect, explaining why stock prices and dividends grew 2% a year slower than GDP.
So if you are going to add buybacks to the dividend yield, you must also allow for the new shares that companies issue. Research Affiliates has just tried to do that work for the US market. Working out the level of buybacks is a relatively easy task; last year, it was around $696 billion (a remarkable 4% of GDP). In contrast, companies don't make it easy to find out how many shares they issued. Here is what Research Affliates did.
We compare the market capitalization of a company at the end of the year to its market capitalization at the beginning of the year, adjusted for the change in the company’s stock price. If the market capitalization is up 10% and stock price is unchanged, there must have been 10% new share issuance. This analysis allows us to determine the amount of a company’s stock buybacks or issuance. We then follow a thorough process of fundamental research into each company’s corporate actions as described in its press releases and by the financial media to determine the source of and reason for the new issuance unexplained by the cash flow statement.
Once you make that kind of calculation, you find that companies issued around $1.2 trillion of new stock, far more than the buyback total. Instead of adding buybacks to the dividend yield, maybe shareholders should be subtracting that number. Some of the stock may reflect share issuance for takeovers of other quoted companies (which is not dilutive). Nevertheless, Research Affiliates reckons that the net dilution was around $454 billion, or 1.8%; pretty close to the 2% mentioned in the Bernstein/Arnott paper.
Why are all these shares being issued? The answer is simple; to meet share option programmes, designed to reward executives. It is robbing Peter to pay the CEO. As Research Affiliates remarks
When management redeems stock options, new shares are issued to them, diluting other shareholders. A buyback is then announced that roughly matches the size of the option redemption. This facilitates management’s resale of the new stock they were issued in the option redemption. Buyback? Not really! Management compensation? Yes.
Because the stock options a company issues its management dilute the value of its stockholders’ shares, companies often repurchase their stock to offset this dilutive effect. The net impact is a transfer to management of more of a company’s cash flow than is reported as compensation on the income statement.
Wealth is transferred from shareholders to executives, helping to explain why executive rewards have far outpaced economic growth or shareholder returns. And Research Affiliates makes another point; companies often accompany buy-backs with debt issuance. In 2014, US companies issued a net $693 billion of debt; almost the same as the gross buyback total. Investors are ending up owning a smaller portion of a more highly-indebted company; more of the cashflows generated by such groups will be absorbed by banks and bondholders. sometimes equity investors must feel like rubes at a carnival sideshow; which paper cup is the ball really under?


Comments